Dashboards & Scorecards
We can help you build industry metrics and visualize beautiful, interactive and powerful real-time business dashboards for your organization, based on Industry Forums & Standards.
Build your Dashboards
We can help build dashboards to provide you real-time visibility into your data. You can monitor your KPIs and get a detailed insights using interactive visualization options. Analyze patterns in data and drilling down to analyze details. We can help:
Pull real-time data from variety of sources, including structured and non-structured datasets.
Build web dashboards that have a sleek and lean look, making it easy for you to understand your company’s data without unnecessary clutter.
Configure your dashboard to get the most insights out of your data. Build graphs to view comparative analysis between channels, regions, brands, products, or customer segments.
Track your KPIs during particular time range or to-date (MTD, YTD, LTD etc.). Add Widgets to enhance graphics, presentations, and interactive options.
Monitor your dashboards on all medias including desktops, web, mobile devices, tablets, or even large TVs.
Exhibits
Retail Analysis Dashboards
Visualize data on your retail sales channels. Monitor performance of regions, stores, brands, product. Identify Customer buying patterns and demographics. Read More...
Marketing Campaign Dashboards
Get insight into your marketing performance Cost vs ROI. Analyze Traditional vs Digital marketing Channels. Monitor Interactions, and plot your Reach and Conversion Rates. Read More...
Subscriber Dashboards
For subscriber based industry Subscriber Dashboards can help you stay on top in touch competitive environment. And provide your robust and relevant operational and financial metrics that are critical to informed decision making. Read More...
eCommerce Dashboards
Track your sales and supply chain. Monitor sales, shopping carts, conversion rates, product affinity, orders, fulfillments and inventory levels. View site traffic on product hits, social media, and customer demographic. Watch customer service metrics and resolutions.
Industry Scorecard Models
Our consultants have expertise and in-depth knowledge of various industry segments to help you visualize right metrics based on industry forums and standards.
Telecommunication
Based on tmforum Business Metrics Balanced Scorecard approach in three domains:
- Revenue and margin: A view of fiscal performance
- Customer experience: Measures that impact the end-customer reaction to the service offering
- Operational efficiency: A view of cost and expense drivers
Healthcare
Various dashboard in healthcare industry, such as
- Hospital dashboards providing info on Admissions, Emergency Rooms, Income & Spending.
- Clinical dashboards showing wait times, income and spending.
- Patients dashboards on number of patients, lab turnaround times, average length of stay.
- Physician dashboards showing registered patients, patient satisfactions, monthly showings.
- Pharmaceutical showing profitability, prescription productivity, patient demographics, inventory logistics, compliance, corrective and preventive actions, customer satisfactions.
Retail
Noted industry metrics such as
- Customer Retention & Loyalty, Retention Rates, Churn Rates
- Customer Satisfaction, Interaction metrics, Social Media metrics
- POS, Sales Channels & Touch points
- Sales & Revenue metrics
- Cost, Margins & Profitability
- Operational & Service Level metrics
- Logistics & Inventory metrics
Logistics
Measure your supply chain performance based on Supply Chain Operations Reference (SCOR) Model.
- Monitor Reliability (Fill rates, Perfect Order, Delivery Quality etc)
- Responsiveness (Lead times, Accuracy etc)
- Flexibility
- Cost (COGS, Return Rates, Inventory valuation etc)
- Asset Management Efficiency (Stock on Hand, repair cycles etc)
Retail Analysis Dashboards
Retail dashboards can visualize data on your retail sales channels, your brands and products, your customer segments, help analyze buy and sales patterns, understand your customer demographics. Monitor your inventories and perform demand planning.
Geographical
Geographical Performance through interactive maps and charts. View sales regions, stores, sales reps. Identify the most profitable sub-region.
Brands & Products
Monitor Performance of Brands and Products, add-ons, cross sell and up sell.
Customer Segmentation
Review Customer Purchase patterns, profile customer segments, and understanding the sales funnel. Identify buyer demographics.
Demand Planning
Through retail planning dashboards view demand predictability, merchandise profitability and inventory liability.
Store Traffic
Tap on Store traffic and campaign up takes, Review Stock Levels
Marketing Campaign Dashboards
Get insight into your marketing performance Cost vs ROI. Analyze Traditional vs Digital marketing Channels. Monitor Interactions and social media, and plot your Reach and Conversion Rates.
Marketing Performance
View your marketing performance, monitor overall cost per lead, number of leads, average deal time, total acquisition cost over time, and drill down to regions.
Campaign Performance
Evaluate your top performing campaigns for each channel and regions. View end to end marketing and sales funnels and conversion rates and volumes, and drill down to Sales Reps.
Lead & Prospects
View end-to-end sales funnel, track your open/closed lead counts on time scale, and their sources. Monitor leads through marketing campaigns and conversion rates. Pull data from your lead management systems like Sales Force.
Interactions
Plot Customer or Lead interaction metrics, by channels, by regions, by store, by sales reps. View Interaction Reasons (sales, support, payment etc) and Channels. Visualize customer experience map and behavior across all touch points (store, call center etc). Drill down to point of relationship (encounter, transaction etc) and touch point owner (department or rep). Improve operational efficiency, customer experience or upsell..
Social Media
Monitor your social media counts and compare them side by side. Follow referrer and traffic source, word counts, likes, analyze tweets. Identify your demographics and regions.
Subscriber Dashboards
For subscriber based industry Subscriber Dashboards can help you stay on top in touch competitive environment. And provide your robust and relevant operational and financial metrics that are critical to informed decision making.
Subscriptions & Drill down
Track number of subscription throughout customer life cycle, e.g. new subs, base subs, suspends, renewals, cancels, reactivations, gross adds, net adds, subs growth rate. Drill down and zoom in to transactions and channels contributing to these metrics.
Brands, Products & Add-on Features
Monitor your brands and products for each subscription. Track add-on features during sales and after sales, upgrades, downgrades, cross sale. Compare brands and product line performance in various regions.
Discounts & Promotions
Track your campaigns, discounts and promotions. Identify promotion performance viz a viz other metrics e.g. upgrades, reacts, gross adds. View cancellation against promotion expiries.
Churn & Deactivations
In-depth view of Deactivation and Churn rates. Trend churn over other dimensions including timescales, brands, productions, regions, campaigns, promotion expiries, interactions, deactivation reasons etc. Understand voluntary and involuntary churns, and causes of churn. Track cannibalization within organizational brands.
Segments & Demographics
Identify customer & subscriber segmentation and demographics.
History
View metrics recording historical metrics, customer/subscriber orders, payments, issues, interactions etc. Drill down to see detailed registers.
Revenue
Average Revenue Per User (ARPU) based on base counts, average counts, BOM/EOM counts, acquisition cost, average revenue per household account/customer (ARPA/ARPC), customer lifetime value (CLV), average margin per user: (AMPU), cost per gross add: (CPGA). Drill down to revenue transactions. Filter transaction types to perform what-if. Single out credits that are impacting ARPU to improve acquisition cost.
Predictive Analysis
Mine your data to identify actionable insights, through advanced segmentation strategies and processing big data to develop deeper understanding of your customers,. Predict their behavior and improve customer experience, and Synthesize data from across multiple channels to better target the right customer with the right offer at the right time. Utilize predictive analytics techniques to uncover previously hidden patterns to get more precise customer segments that will help to fine tune your strategy.
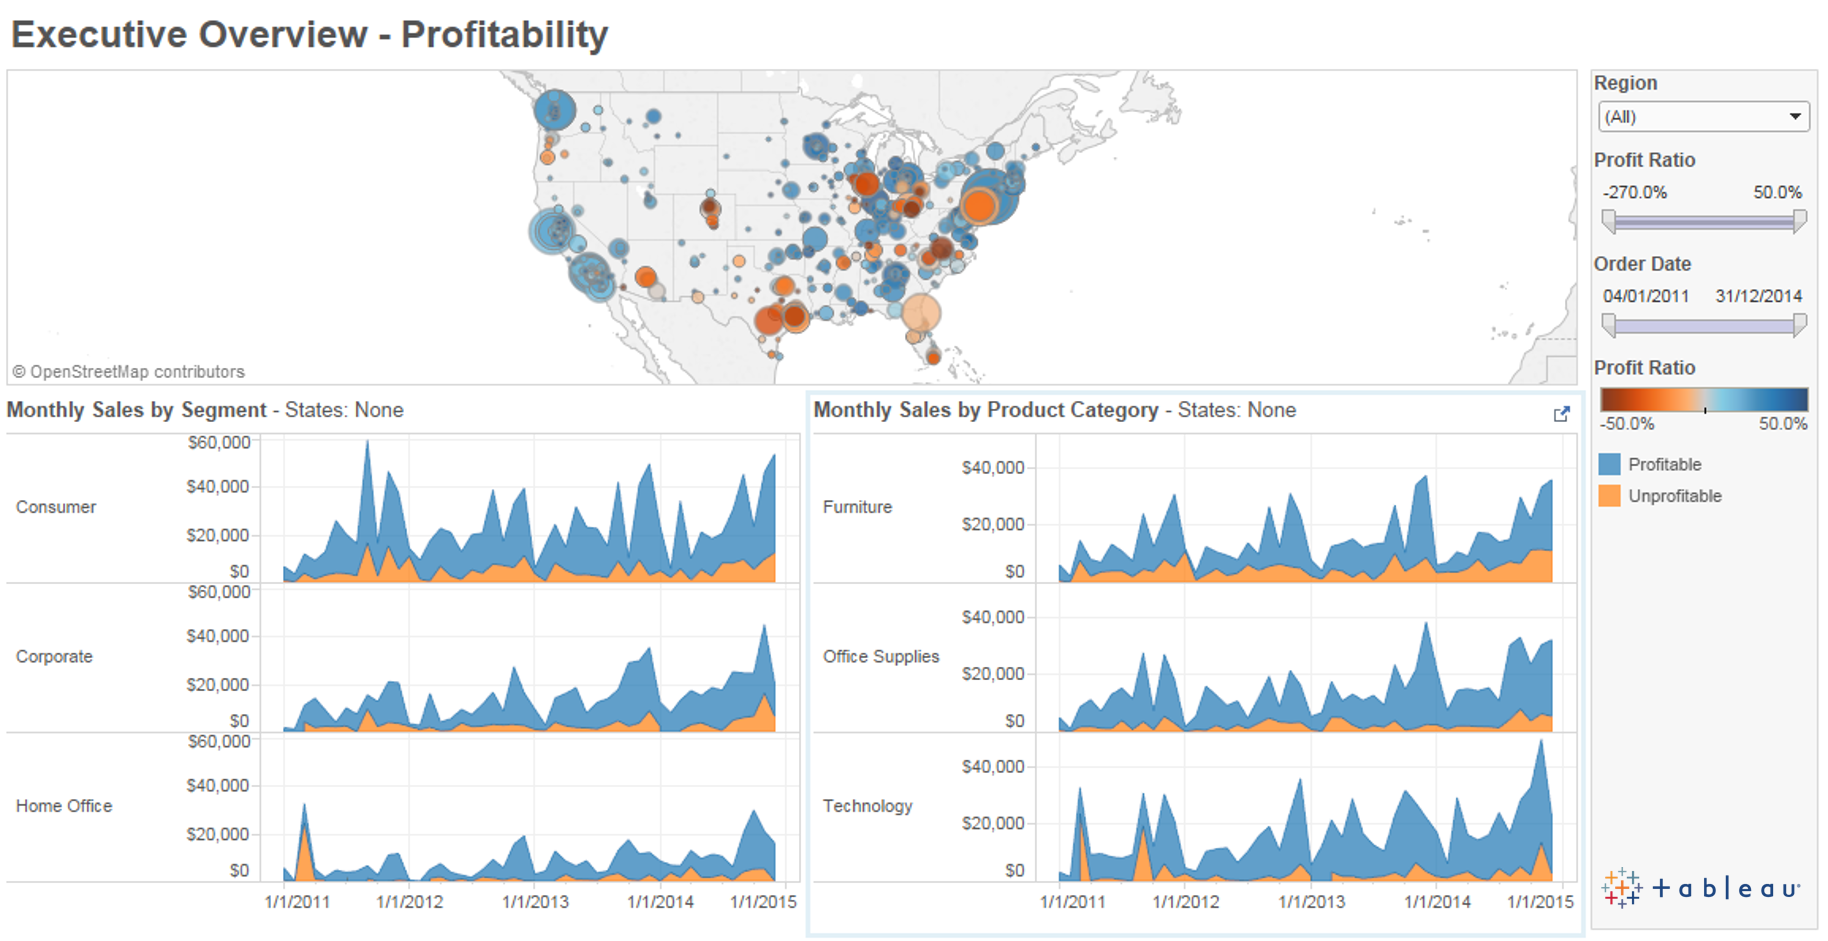
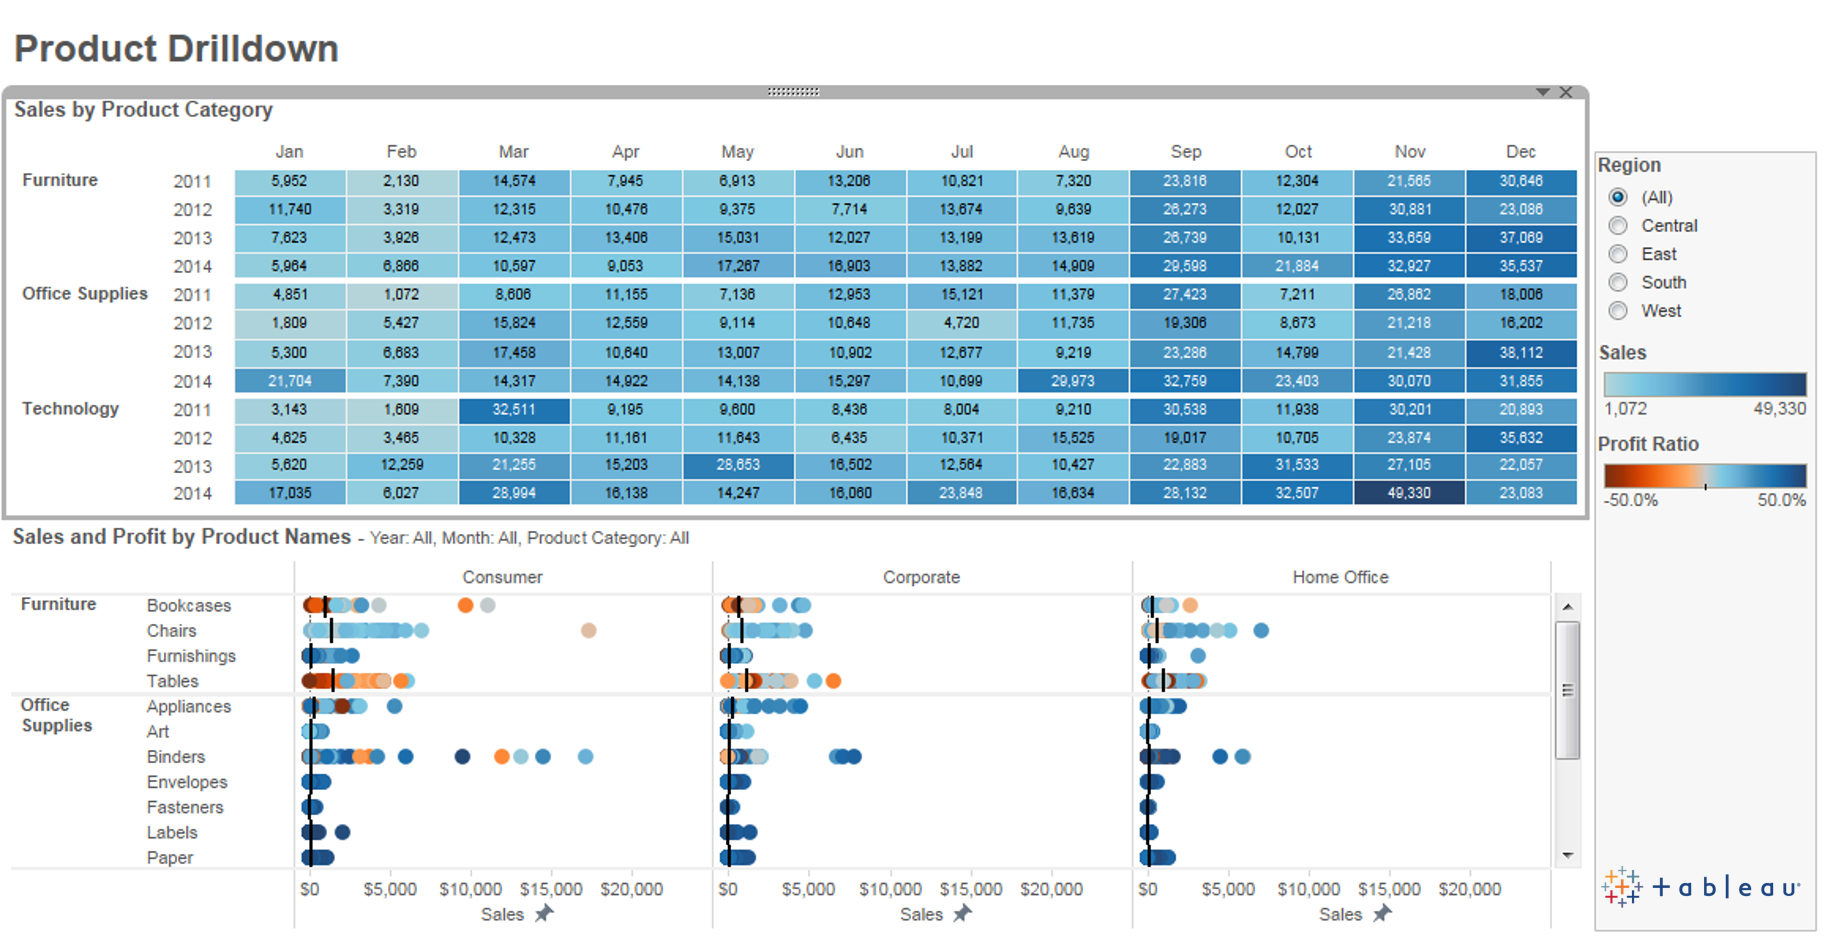
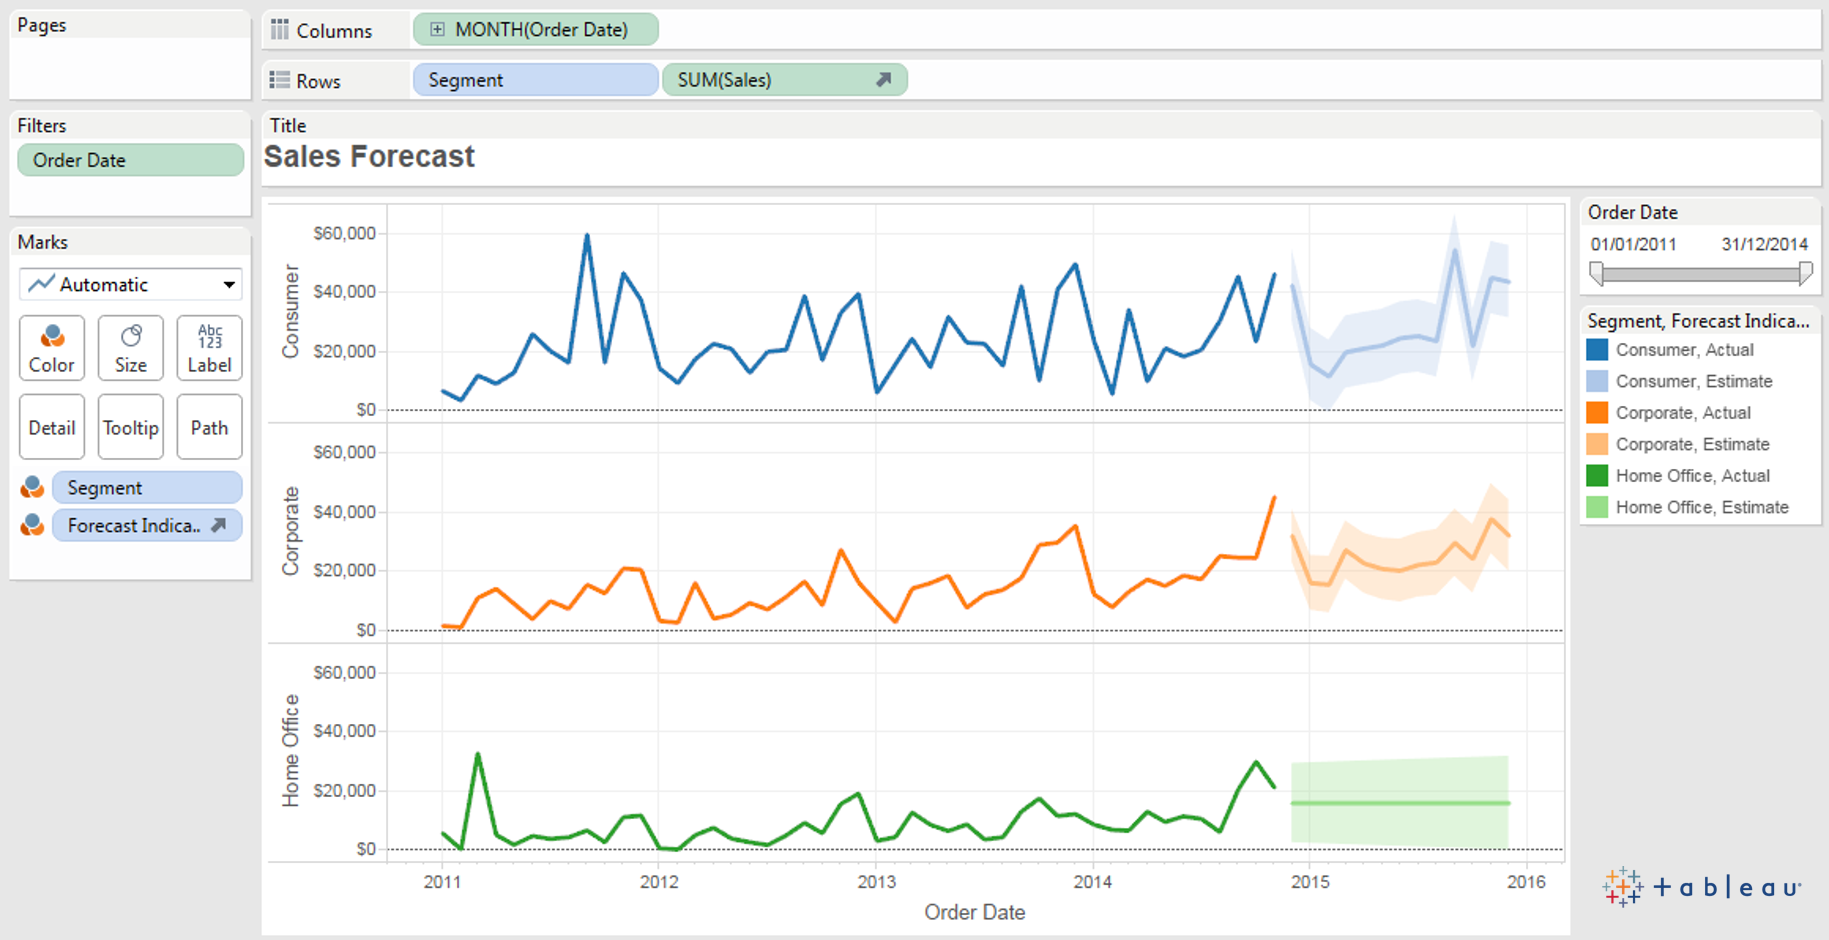
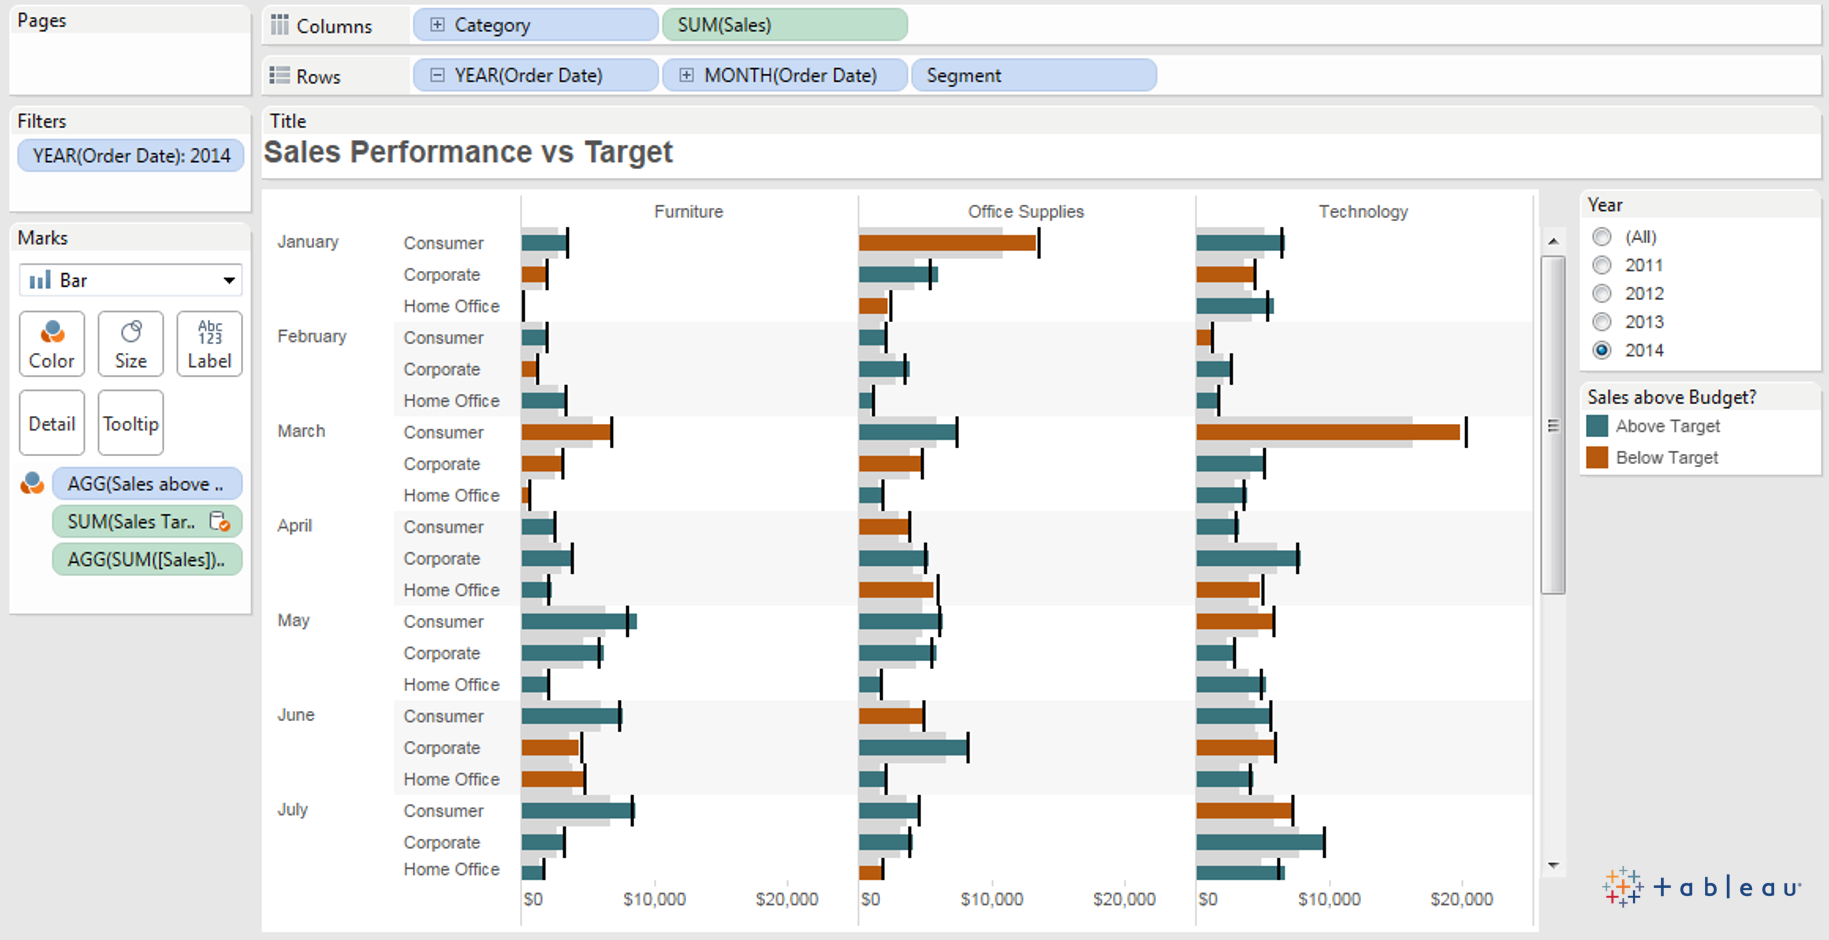
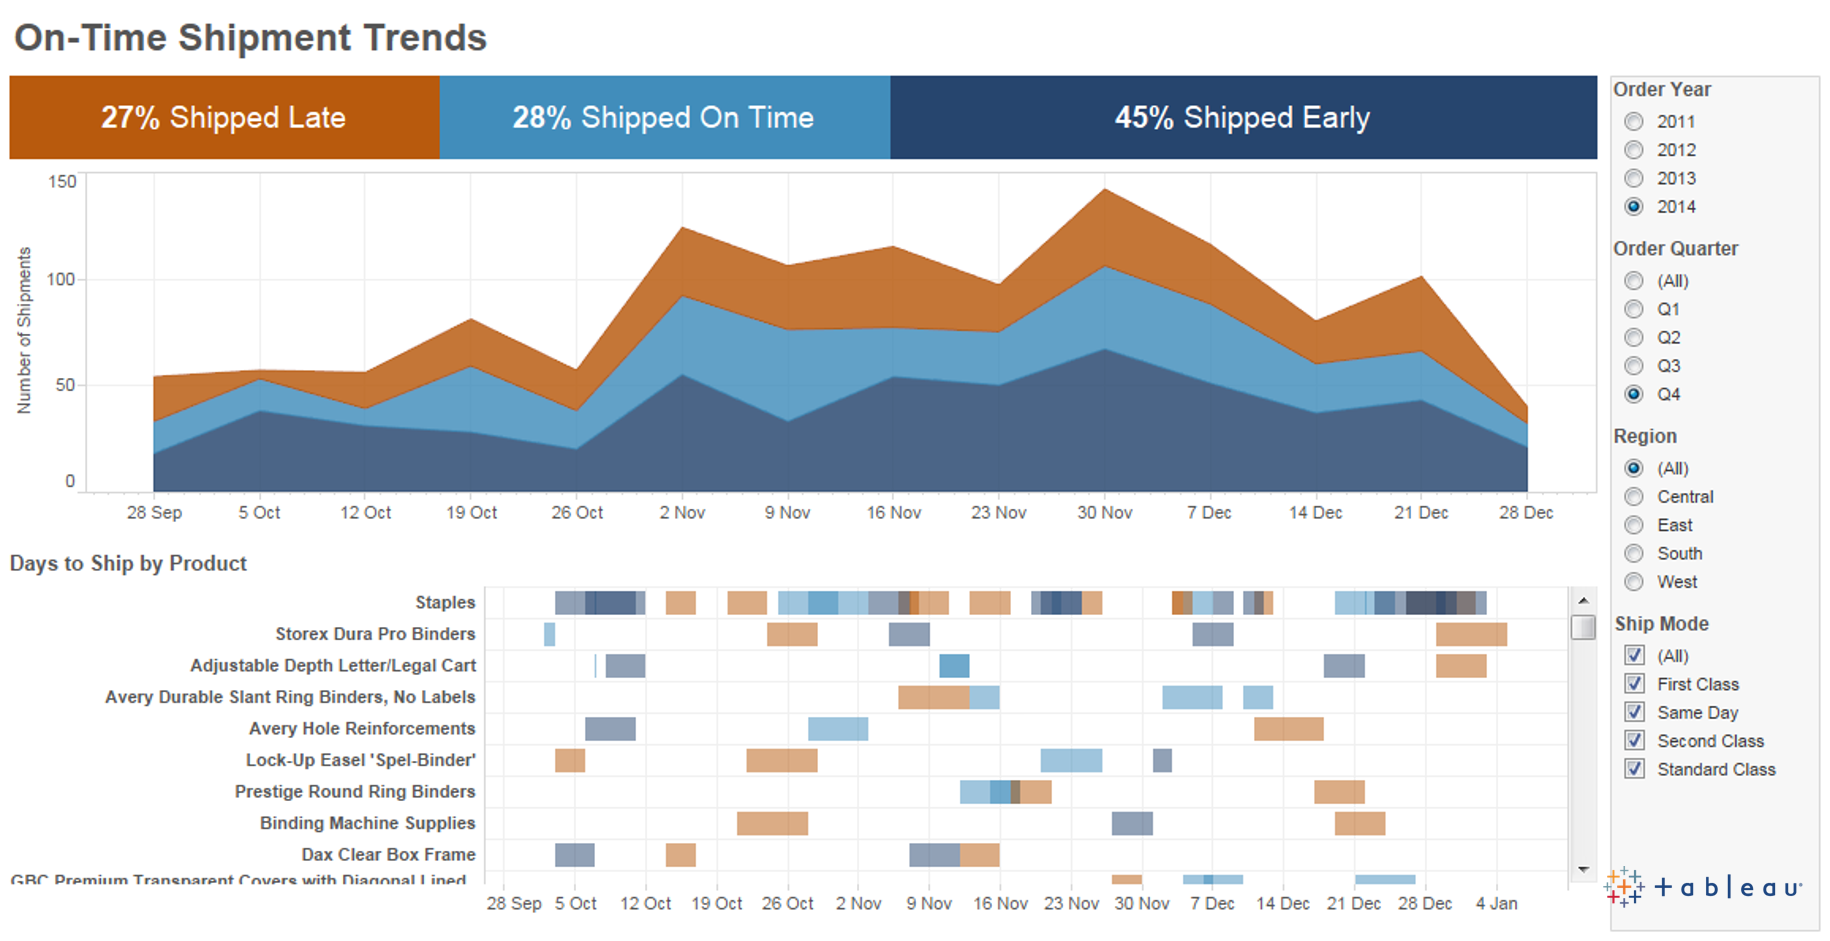
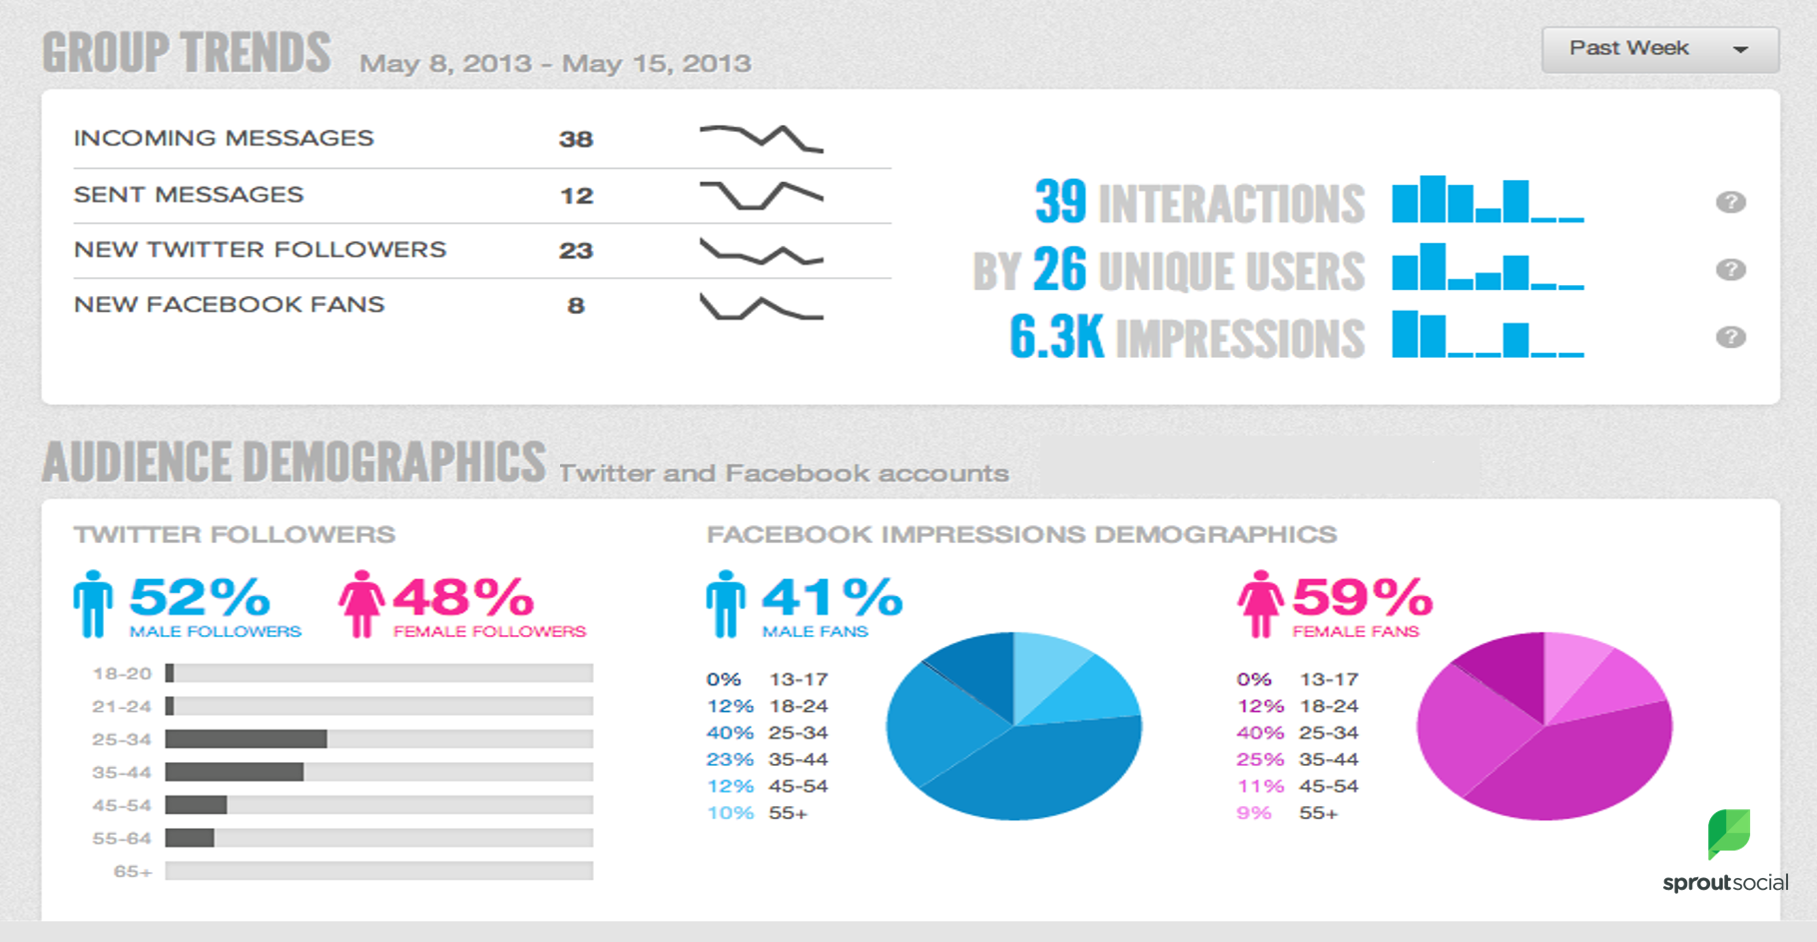
Dashboard Examples
Following are examples of various dashboards.